Read the measurement before naming the molecule
Imagine two DNA samples producing bands at the same height on a gel. It is tempting to announce that both samples contain the same gene. Yet the picture has primarily compared how the molecules moved, not read their nucleotide sequences. A useful interpretation begins with the observation, adds the conditions that make it meaningful, and stops before claiming information the method has not supplied.
This guide concentrates on agarose-gel separation of linear double-stranded DNA fragments. Its chapter anchor is NCERT Class 12 Biology, Chapter 9, Biotechnology: Principles and Processes, in the 2026-27 reprint. The numerical lanes below are invented teaching examples. They practise how to reason about size separation; they are not experimental results or instructions for interpreting a person's test.
Find the wells, then follow the electrical direction
The phosphate groups give DNA a negative charge. An applied electric field drives it toward the positive electrode. Agarose provides a porous matrix: under comparable conditions, shorter linear DNA fragments migrate more readily and usually cover more distance than longer ones. The electric field supplies direction; the matrix helps produce separation by length.
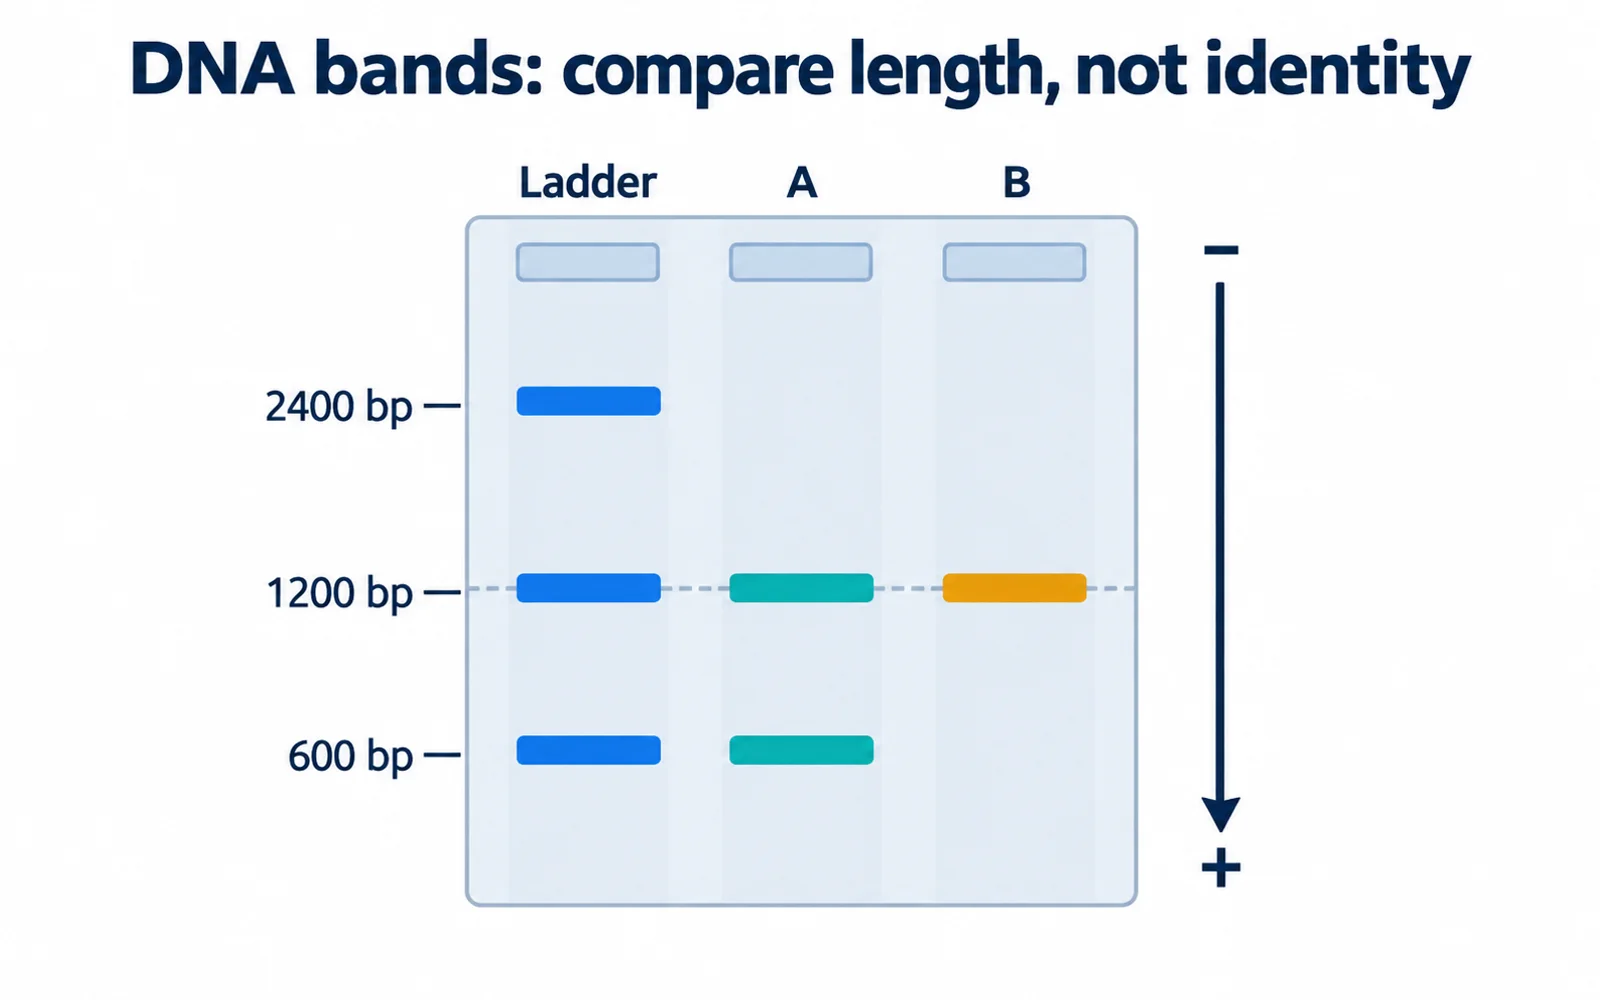
Locate the sample wells before deciding which band travelled farthest. In the original diagram, wells are at the top and the positive end lies below them. A lower band has therefore moved farther. Rotating the drawing would change which band appears lower on the page, but would not change its distance from the wells. Do not memorise a page direction in place of the physical relationship.
Each vertical lane is a sample's migration path. A visible band is a population of DNA molecules concentrated within a narrow region. It is not a single DNA molecule drawn large enough to see. The coloured marks in our illustration are a schematic representation of detected DNA, not the colour of unstained DNA.
Keep an observation ledger
Divide your working notes into two lines: what the gel displays, and what you infer under stated assumptions. For example, 'aligned positions' is the observation and 'approximately equal linear-fragment lengths' is the interpretation. Writing 'identical gene' would add a different kind of claim without a corresponding measurement.
Audit the claim attached to a band
These readings assume comparable linear DNA samples on the same gel. The final column supplies a specific countercheck before accepting a stronger claim.
| Visible feature | Defensible reading | Countercheck before claiming more |
|---|---|---|
| A band farther from the wells | A shorter fragment class under this model | Was the starting position identified correctly? |
| A band level with a known ladder band | An approximate matching length | A length standard does not reveal base order |
| Two bands in one sample lane | Two resolved migration positions | Equal-length sequence types can share a position |
| A single strong band | A concentrated detectable signal | Neither sequence purity nor molecule count follows automatically |
| No visible band | No resolved signal detected here | Low abundance or detection limits remain possible |
| Several bands from uncut plasmid DNA | Possibly different molecular conformations | Do not assign each band a new length without checking shape |
Use a ladder as a ruler with known fragments
A DNA ladder contains fragments of specified lengths and is separated alongside the samples. Comparing a sample band with these reference bands supports an approximate length estimate. Length is normally expressed in base pairs, abbreviated bp; 1000 bp equals 1 kilobase pair, commonly written 1 kb. Read the ladder's stated sizes rather than assuming its bands are equally spaced in length.
Our schematic ladder contains 2400, 1200 and 600 bp reference fragments, from nearer to farther from the wells. The numbers halve, but the illustration is not a calibrated distance scale. Without an actual calibration, a band halfway between two markers should not automatically be assigned the arithmetic mean of their lengths. For a revision problem with no further calibration, the defensible answer may simply be that its length falls between the two reference values.
A three-size example separates observation from identity
Suppose sample A has one band aligned with the 1200 bp marker and another aligned with the 600 bp marker. Sample B has one band aligned with the 1200 bp marker. Assume the samples are linear double-stranded DNA and were resolved under the same conditions. The A lane supports two resolved size classes near 1200 and 600 bp. Its 600 bp material travelled farther. The B lane supports detectable DNA near 1200 bp.
The length ratio of A's two classes is 1200:600, or 2:1. This does not make their travel distances a 2:1 ratio, and it says nothing by itself about how many molecules are in each band. The shared 1200 bp position across A and B supports similar fragment length. It does not establish the same base order, the same gene or the same organism of origin.
For a simple logical check, consider the invented four-letter sequences AAGC and ATGC. They have equal length and different content. These tiny strings are not intended as fragments for our agarose diagram; they demonstrate why counting positions cannot identify the letters occupying them. A claim about sequence requires evidence sensitive to sequence, beyond matching band position.
Count resolved positions, not invisible sequence types
Now imagine a hypothetical preparation containing three fragment types of lengths 1800, 900 and 900 bp, with different sequences in the two shorter types. If the two 900 bp populations migrate together and the two length classes resolve, the image can show two band positions. There are three stipulated fragment types but only two distinguishable positions. Adding another type need not add another band when its migration is indistinguishable.
The reverse shortcut also fails: one band does not guarantee a pure sequence. Close lengths may be unresolved, and insufficient signal may hide material that is present. An empty-looking lane therefore does not prove that its starting sample contained no DNA. It records what was detectable under the conditions of that observation. These limits are reasons to phrase conclusions carefully, not to discard all size information.
Brightness and shape need their own assumptions
Under comparable staining and imaging conditions, band intensity can help estimate DNA mass, but it is not an automatic count of molecules. In an idealised equal-mass comparison, a 1200 bp molecule contains roughly twice the DNA mass of a 600 bp molecule. The shorter-fragment band would therefore contain about twice as many molecules. Equal mass and equal molecule number answer different questions; brightness alone is not a precise measurement of either.
Keep the linear-fragment assumption visible. Uncut plasmids can exist in different conformations, including supercoiled and nicked forms, and can migrate differently despite having the same base-pair length. A size estimate based on a linear DNA ladder cannot simply be transferred to every uncut plasmid band. For this revision guide, recognising that boundary is enough; detailed topology analysis belongs beyond the basic size-reading model.
Reconstruct the gel and attach a limit to each claim
On blank paper, draw three wells and label one lane as the ladder. Add its 2400, 1200 and 600 bp bands, place A at 1200 and 600, and B at 1200. Mark the positive direction away from the wells. Beside each sample, write one supported conclusion and one claim that would need additional evidence. Your drawing should distinguish distance, length and identity without using a copied illustration.
Check the reconstruction: A has two resolved positions; B aligns with A's longer fragment; A's shorter fragment moved farther; neither shared height nor a single band proves a unique sequence. Finally explain why electrophoresis can reveal a pattern after PCR but cannot itself create more target copies. If you can justify each sentence by pointing to a measurement or a stated assumption, you have moved beyond recognising the vocabulary.
Common confusions to check
- A smaller linear fragment generally travels farther in the same run; its lower position does not mean greater length.
- One detected band contains many molecules and may contain different sequences of indistinguishable migration.
- Matching band heights support similar length, not identical nucleotide order.
- Band brightness concerns signal and, under controlled comparisons, mass; it is not a direct molecule counter.
Editorial note and disclaimer
Written by: DongFeng. Published by: MedQGo. Last updated: October 11, 2026.
Disclaimer: This guide is a revision aid for NEET-UG aspirants and does not constitute medical advice. For clinical or health-related queries, consult a qualified medical professional.
References
- NCERT Class 12 Biology, Chapter 9: Biotechnology - Principles and Processes (2026-27), section 9.2.1
- NHGRI: Electrophoresis - matrix separation and known-size standards
- Addgene: Agarose Gel Electrophoresis - migration and DNA ladder interpretation
- Addgene: Plasmids 101 - restriction digest analysis and plasmid conformations
Related revision guides
How to use this guide
Read the relevant NCERT chapter first. Then redraw the relationships or process described here from memory, compare your version with the textbook, and correct only the gaps. This is an independent revision aid, not official NCERT, NTA, or NEET material.