Begin with an organism in its environment
Ecology begins by asking how an organism responds to its surroundings. Abiotic factors such as temperature, water and light influence where organisms can survive and reproduce. Biotic factors include other organisms, whether they are competitors, predators, prey, parasites or mutualistic partners.
An organism's habitat is the place where it lives; its niche describes its functional role and relationship with resources and other organisms. These terms are connected but not identical. A habitat gives the physical setting, while a niche asks how the organism uses that setting.
A population has attributes that one organism cannot have
A population consists of individuals of the same species living in a defined area at a given time. Population density, birth rate, death rate, age structure and sex ratio describe the group rather than a single individual. When a prompt gives a number, first ask whether it is measuring an organism, a population or a community.
Population size can change when births and immigration add individuals, while deaths and emigration remove them. This four-arrow accounting step is more useful than learning growth curves in isolation because it tells you why the number might rise or fall.
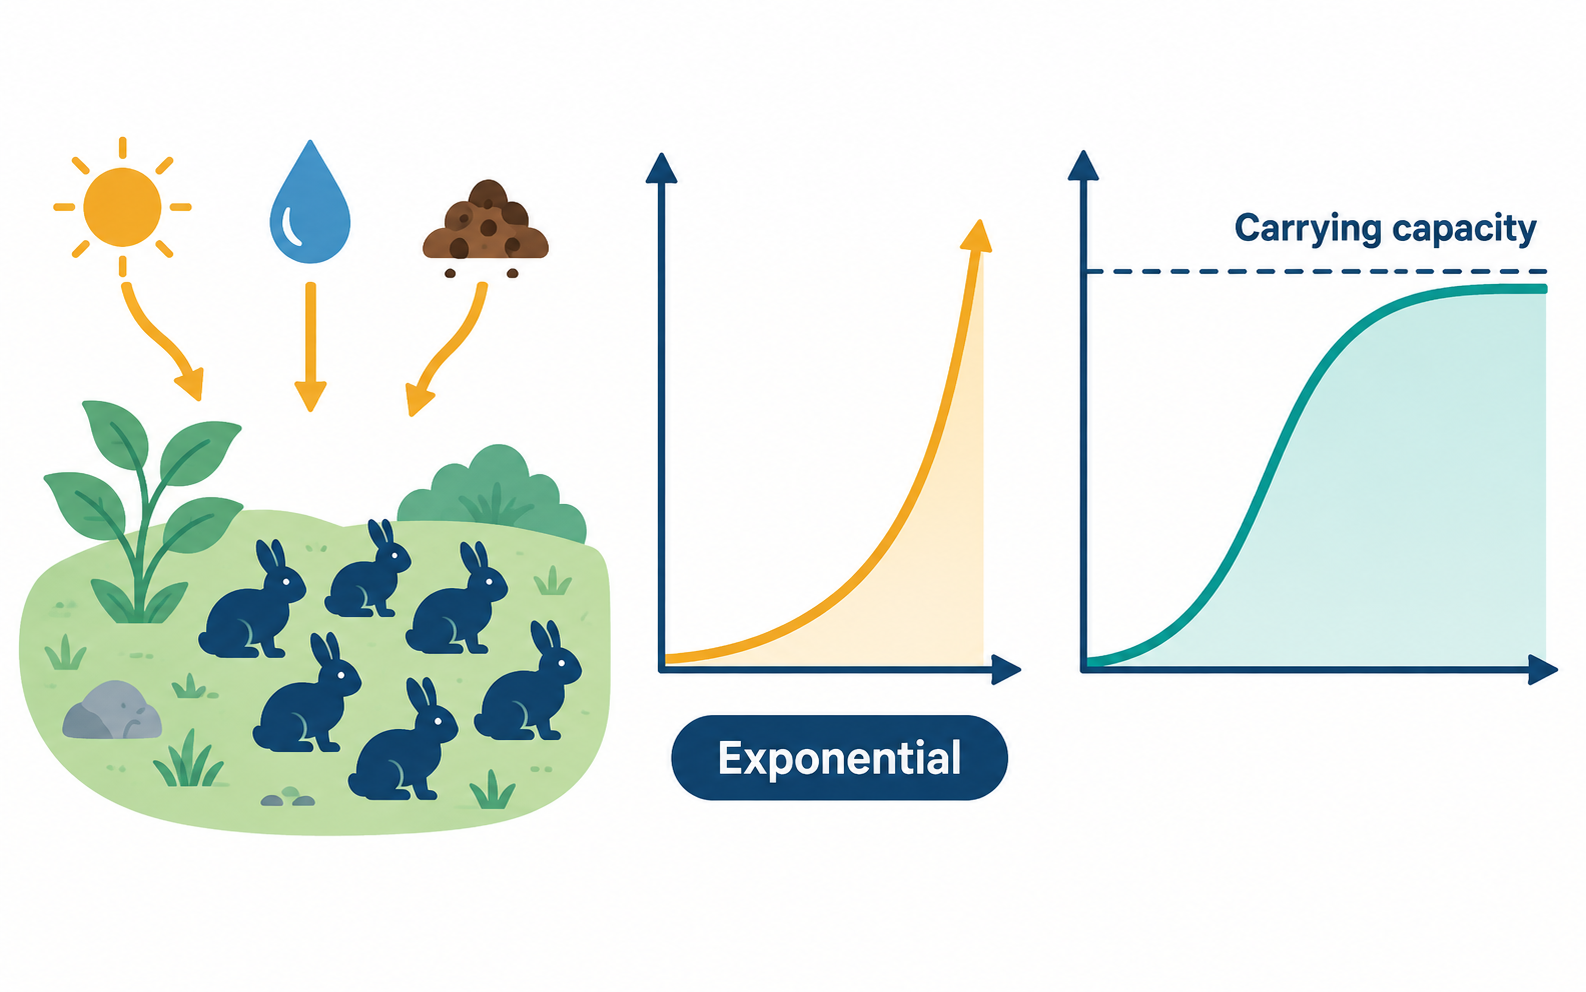
The population-and-resource check
Put a measure back into its ecological context before accepting an answer about growth or regulation.
- Population attributes such as density, birth rate and age structure belong to groups, not individual organisms.
- Births and immigration add individuals; deaths and emigration remove them.
- Exponential growth is a model for abundant resources, while logistic growth includes environmental resistance.
- Carrying capacity describes what a particular habitat can support and can change as conditions change.
A curve without a habitat is only half an explanation
A J curve or S curve becomes useful only after its resource assumption is stated. The models are tools for relating a changing population to the conditions in its habitat, not labels that replace ecological reasoning.
The most important boundary is that K belongs to an environment at a time. A shift in water, food, space, disease pressure or another ecological factor can change the supportable population level.
Population growth: start with the resource assumption
The curve is an output of assumptions about resources and environmental limits, not merely a shape to memorise.
| Model or measure | Main assumption | What the pattern shows | Do not confuse with |
|---|---|---|---|
| Population density | Individuals are counted in a stated area or volume | How crowded a population is in its habitat | The size of one organism |
| Exponential growth | Resources are effectively unlimited in the model | J-shaped increase | A permanent real-world outcome |
| Logistic growth | Resources become limiting as population rises | S-shaped growth toward carrying capacity | A fixed number unrelated to environment |
| Carrying capacity (K) | Habitat resources set a supportable population level | Environmental limit in the logistic model | A universal constant for a species |
J-shaped and S-shaped curves answer different resource questions
Exponential growth produces a J-shaped curve in a simplified situation with abundant resources and no effective limit on growth. It describes what a population could do under favourable conditions; it is not a promise that a real population will rise indefinitely.
Logistic growth includes environmental resistance and a carrying capacity, often represented by K. As population size approaches the supportable level for that environment, growth slows and the curve becomes S-shaped. Carrying capacity is tied to a particular habitat and its available resources, so it can change when environmental conditions change.
Work a population balance with an explicit time interval
Suppose a defined study area starts a month with 120 individuals. During that month there are 18 births, 7 deaths, 5 immigrants and 11 emigrants. The end count is 120 + 18 - 7 + 5 - 11 = 125. The increase is five individuals, even though births alone were eighteen. This is a hypothetical bookkeeping example; each count must refer to the same area and interval.
If the area is 5 square kilometres, the starting density is 24 individuals per square kilometre and the ending density is 25. Population size and density are interchangeable only if the area is fixed. Counts are not always the most useful measure: percentage cover can describe a spreading plant population better than attempting to separate every connected shoot.
Read the axes and slope before deciding which curve you see
On the growth sketch, the horizontal axis is time and the vertical axis is population size N. For the simple exponential model, dN/dt = rN: the per-capita rate r is fixed, but the absolute increase grows as N increases. For logistic growth, dN/dt = rN(1 - N/K); the additional factor reduces growth as the population approaches K.
For an original comparison, set r to 0.2 per year and K to 200. At N = 50 the logistic instantaneous growth rate is 7.5 individuals per year. At N = 100 it is 10, and at N = 150 it returns to 7.5. The largest total growth rate in this model occurs halfway to K, not at K. These are model rates at particular population sizes, not exact one-year census predictions.
At N = K the model gives zero net growth, which does not imply that every birth and death stops. Births and losses can balance. A real population may fluctuate around its resource limit, and a change in the habitat can shift that limit. The smooth S curve is a simplified explanation of regulation rather than a tracing of every natural population.
Use two signs to keep species interactions distinct
Assign one sign to each species: a benefit is positive, a cost is negative and no appreciable effect is zero. Mutualism is positive for both; competition is negative for both; predation and parasitism benefit one participant while harming the other. Commensalism benefits one without an appreciable effect on the other. Always keep the species order fixed when interpreting the signs.
A lichen combines fungal and photosynthetic partners, while an orchid growing as an epiphyte uses a tree for support without taking its nutrients as a parasite would. Both examples involve close association, but that observation alone does not identify the interaction. State what each partner gains or loses. Population interactions connect this chapter to natural selection when differences in survival and reproduction affect inherited variants over generations.
As a final check, explain why a population with many prereproductive individuals may have growth potential without its current count already being high. Age composition describes who can contribute to future reproduction; a census total gives only how many individuals are present now.
A population-accounting recall routine
Make a two-part sketch. On the left, write births and immigration with arrows into a population circle, then deaths and emigration with arrows out. On the right, draw a J curve and an S curve, adding a dashed horizontal line only to the S curve for carrying capacity. State what resource assumption distinguishes the curves.
Finish with three checks: Is density a property of one organism or a population? What does K describe? Why can carrying capacity change? These questions force the model back into an actual environmental context.
Common confusions to check
- Habitat is the place an organism lives; niche is its functional role and resource relationship.
- Density is a population property, not a characteristic of one organism.
- Carrying capacity belongs to an environment and can change; it is not a permanent universal number for a species.
Editorial note and disclaimer
Written by: DongFeng. Published by: MedQGo. Last updated: September 18, 2026.
Disclaimer: This guide is a revision aid for NEET-UG aspirants and does not constitute medical advice. For clinical or health-related queries, consult a qualified medical professional.
References
Related revision guides
How to use this guide
Read the relevant NCERT chapter first. Then redraw the relationships or process described here from memory, compare your version with the textbook, and correct only the gaps. This is an independent revision aid, not official NCERT, NTA, or NEET material.