Start with the units, not the size of the number
A vegetation survey reports 600 grams of dry biomass per square metre. Another reports 600 grams per square metre per year. The numbers look identical, but only the second includes a time interval and can describe a production rate. Before comparing ecosystems, underline the unit and decide whether the measurement is a stock at one time or an amount produced over an interval.
This guide is a measurement workshop for NCERT Class 12 Biology, Chapter 12, section 12.2, Productivity. The ecosystem overview explains trophic routes and pyramids. Here the task is narrower: keep the producer budget, the time basis and the standing crop separate, then decide which calculations the supplied evidence actually permits.
The subtraction belongs inside the producer boundary
Gross primary productivity, GPP, describes producers' total rate of organic-matter production through photosynthesis. Net primary productivity, NPP, is what remains after the producers' own respiratory use: NPP = GPP - R. All terms must use a matching area, time interval and measurement basis. In this equation, R is producer respiration, not respiration by every organism in the ecosystem.
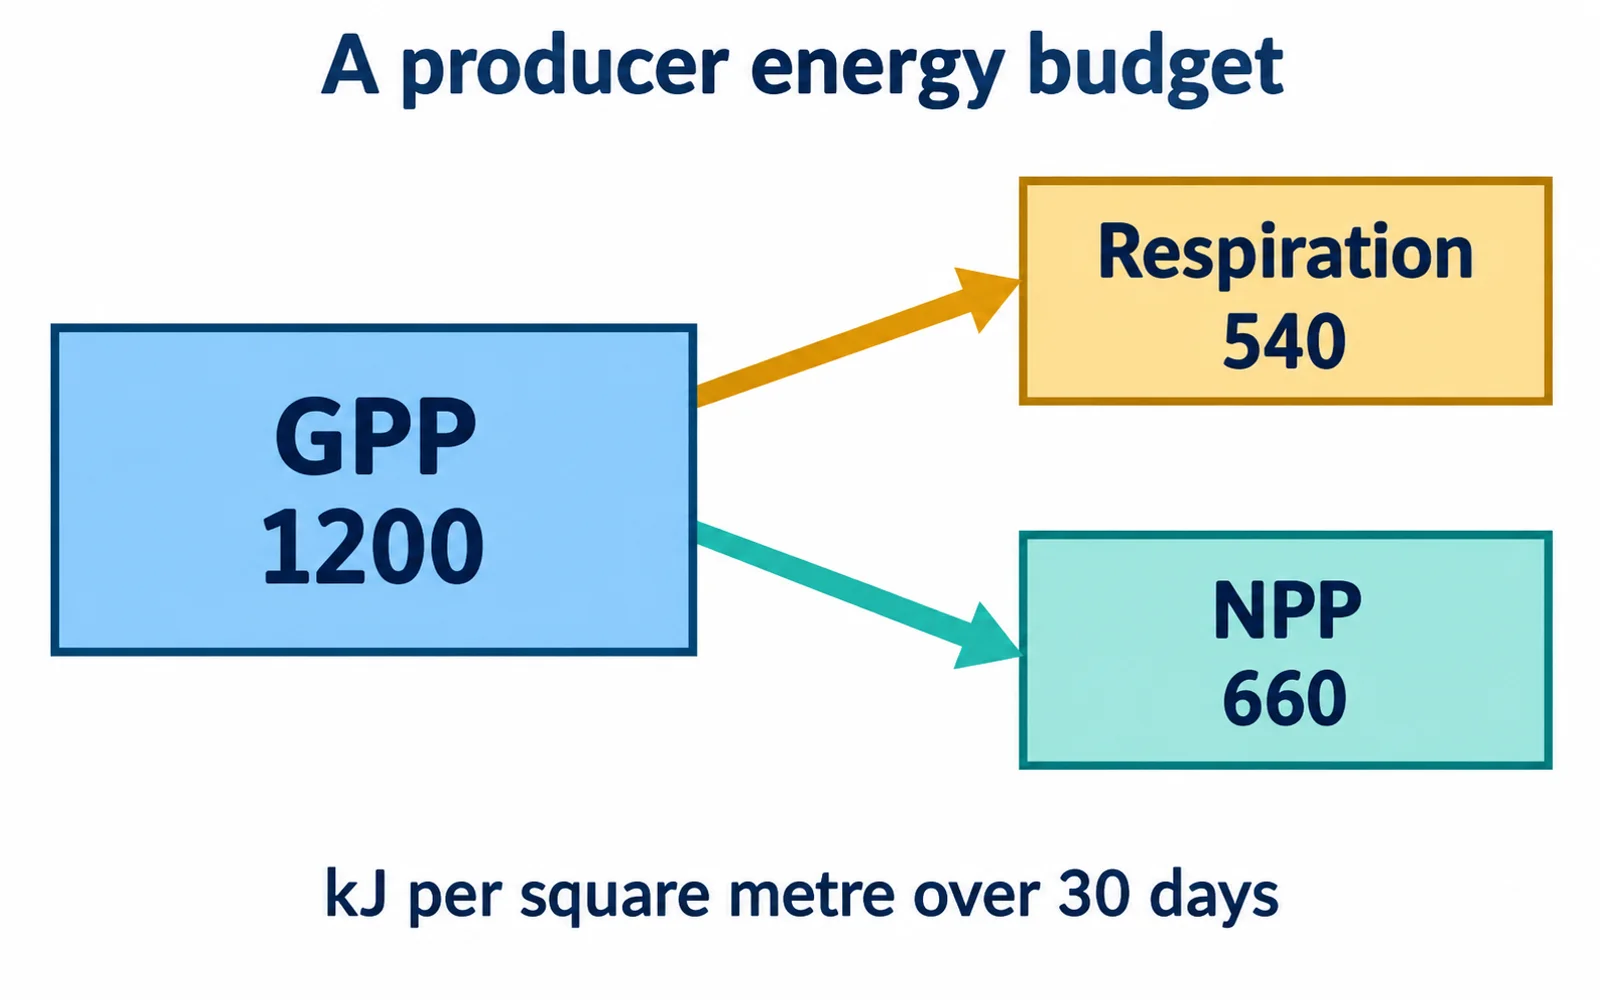
The original budget diagram keeps respiration and NPP as separate destinations from GPP. It does not send all NPP straight into an animal. Net production can contribute to growth, reproduction, grazing or material that later reaches detrital pathways. Secondary productivity describes formation of new consumer biomass; it is not another name for producer NPP.
Keep the unit attached to the answer
Writing only 660 loses part of the solution. In the example below, the answer is an energy amount per square metre over a stated 30-day interval; its daily average is 22. Retain the unit and interval on your final line so that a numerically correct result cannot be mistaken for a different measurement.
What each measurement allows you to infer
A missing time unit or an unspecified respiration boundary can invalidate otherwise correct arithmetic.
| Reported measurement | Interpretation | What is still needed? |
|---|---|---|
| GPP in kJ per square metre per day | Gross producer production rate | Producer respiration on the same basis to obtain NPP |
| NPP in g dry mass per square metre per year | Net producer production rate | Losses and initial stock to calculate ending live biomass |
| Standing crop in g dry mass per square metre | Live biomass at the sampling time | Production and losses over time to explain change |
| Total production in g per plot | Amount for that plot and interval | Plot area and duration for a comparable rate |
| Consumer production rate | New organic matter formed by consumers | A separate feeding and metabolic budget to explain efficiency |
Repair a calculation with mismatched time intervals
An invented data sheet gives GPP as 1,200 kJ per square metre for a stated 30-day interval. Producer respiration is reported as an average of 18 kJ per square metre per day across that same interval. First put respiration on the 30-day basis: 18 x 30 = 540 kJ per square metre. The net production over the interval is therefore 1,200 - 540 = 660 kJ per square metre.
If a daily mean is requested, divide 660 by 30 to obtain 22 kJ per square metre per day. You can check the same result by dividing gross production first: 1,200/30 = 40, then 40 - 18 = 22. Agreement between these two routes checks the arithmetic and the time conversion.
The attractive wrong result, 1,182, comes from subtracting 18 directly from 1,200. It mixes a daily rate with a 30-day total. Another unsupported move is multiplying 660 by twelve and presenting it as measured annual production. Seasonal conditions may differ, and a 30-day interval is not an observed full year. A projection would need an explicit assumption; it is not contained in these data.
A standing crop is a snapshot after gains and losses
Standing crop records living material present at a particular time. A highly productive community may have little standing biomass if that material is rapidly grazed, shed or replaced. Conversely, a large accumulated stock does not specify how quickly new material is being produced today. The relation is similar to a tank's water level and its inflow rate: a level does not reveal the flow unless outflows and elapsed time are also known.
For a second invented account, a small producer patch starts an interval with 240 g dry mass per square metre. Net primary production contributes 90 g per square metre during the interval. Suppose 35 g is removed by grazing and 25 g becomes dead litter, with no other gains or losses. The ending live stock is 240 + 90 - 35 - 25 = 270 g per square metre.
The observed stock increased by only 30 g, although NPP was 90 g. Setting NPP equal to ending stock minus starting stock would miss the material produced and subsequently lost from the live pool. Producer respiration must not be subtracted again here: the contribution was already specified as net production. This budget is deliberately simple, with every loss stated so the result can be checked.
Normalise area before ranking two study plots
Suppose plot A produces 150 g of net dry matter over 2 square metres in ten days, while plot B produces 100 g over 1 square metre in the same ten days. Comparing total grams would rank A first. Converting to a common basis gives A = 7.5 g per square metre per day and B = 10 g per square metre per day. B has the greater area-normalised rate in this example.
This result does not establish that the species in B is universally more productive. Light, nutrients, water, temperature and the sampled interval may differ. The calculation supports a comparison of the stated observations, not a permanent biological ranking. The distinction between correcting units and explaining the cause of a difference is worth keeping explicit.
Dry mass and energy are also different measurement bases. If one source reports grams and another reports kilojoules, a conversion requires an appropriate energy content. There is no justified subtraction between 100 g and 40 kJ. Matching the time and area labels cannot repair a mismatch in the quantity being measured.
Do not apply ten percent before defining the transfer
A simplified trophic-transfer exercise may supply a ten-percent assumption. That concerns transfer between trophic levels; it does not define the subtraction from GPP to NPP. In the 30-day example, NPP is 660 because producer respiration was 540. Replacing that calculation with ten percent of 1,200 would discard information that was explicitly provided.
Even after NPP is known, consumer production cannot be recovered exactly unless a transfer relation or the relevant feeding and metabolic measurements are supplied. 'Available to heterotrophs' does not mean every unit is eaten by herbivores or converted to animal growth. Some reaches decomposers. The correct answer to an underspecified calculation can be that an additional quantity is required.
Likewise, subtracting total community respiration from gross production answers a different accounting question from producer NPP. If a data sheet labels R only as 'respiration', identify whose respiration it represents before calculating. A familiar formula is reliable only when the symbols refer to the intended boundary.
Audit an unfamiliar productivity claim in four passes
First circle the measured quantity: dry mass, carbon or energy. Next mark area and duration. Third identify the biological boundary: producers alone or a larger community. Finally list any losses already included in the word net. These four passes usually expose an invalid subtraction before a calculator is needed.
For recall, reproduce the 30-day calculation and the standing-crop calculation on separate lines. Explain why their answers are 660 kJ of net production per square metre and 270 g of ending biomass per square metre. Then name the missing assumption needed to predict consumer production. Being able to state what the data do not show is part of understanding the budget.
Common confusions to check
- A biomass stock does not have the same units as a production rate.
- Do not subtract producer respiration twice when a contribution is already net.
- Ten-percent trophic transfer is not the definition of NPP.
- A short observation cannot establish an annual rate without assumptions.
Editorial note and disclaimer
Written by: DongFeng. Published by: MedQGo. Last updated: October 1, 2026.
Disclaimer: This guide is a revision aid for NEET-UG aspirants and does not constitute medical advice. For clinical or health-related queries, consult a qualified medical professional.
References
Related revision guides
How to use this guide
Read the relevant NCERT chapter first. Then redraw the relationships or process described here from memory, compare your version with the textbook, and correct only the gaps. This is an independent revision aid, not official NCERT, NTA, or NEET material.